
Beyond console.log, the browser console has methods for tables, grouped output, counters, timers, call traces and conditional messages. Each one solves a specific debugging job faster than a plain log line. This guide covers ten built-in Console API methods. It explains what each one does, and when to use it instead of custom formatting code.
What the console actually is
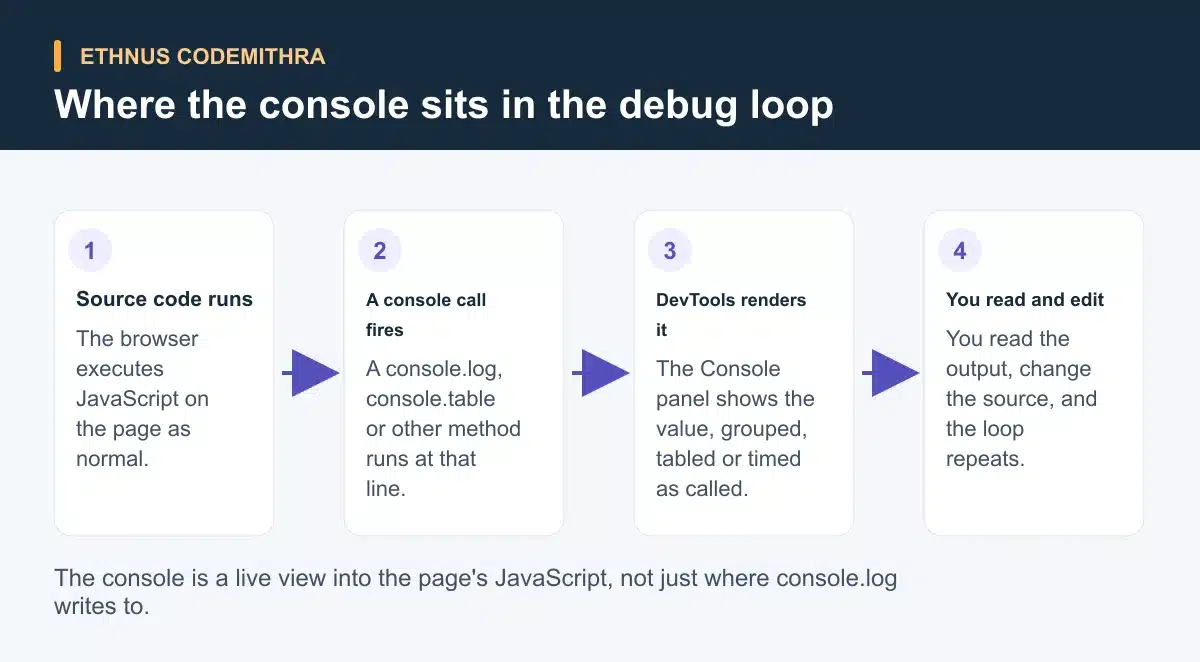
The browser console is not just a place where console.log writes text. It is a live, read-eval-print view into the JavaScript running on the current page. Every major browser builds it into its developer tools. Open DevTools on any page and click the Console tab. From there, you can call any of these methods from your own code. You can also type an expression directly and see it evaluate.
The console renders directly in the browser, so it shows richer output than a plain string. Objects stay clickable and expandable. Arrays of objects can become tables, and related lines can group and collapse. The rest of this article works through ten methods that use those capabilities.
The output methods: log, error, warn, info, debug
console.log() accepts more than one argument and prints each in order, with a space between them. It also supports format specifiers, such as %s for a string or %o for an object. These apply when the first argument contains them. The console.log reference on MDN documents both forms. console.error(), console.warn(), console.info() and console.debug() use the same rendering engine as console.log(). They differ mainly in the log level and icon the browser shows, per the Console interface reference.
Picking the right level pays off once a page logs more than a handful of lines. DevTools filters the console by level. A console.warn() stands out from ordinary console.log() noise. A genuine console.error() stays visible even when you filter everything else out.
console.log("Cart total:", total);
console.warn("Discount code expired, ignoring it");
console.error("Payment request failed", response.status);
Showing data as a table with console.table()
console.table(data, columns) renders array or object data as a table instead of a nested, hard-to-scan object dump. The optional columns argument limits which columns appear in the table. See the console.table reference on MDN for the full syntax. Reach for this method whenever you log a list of similar records, such as API results or form fields.
const students = [
  { name: "Asha", course: "MERN Full Stack", hours: 42 },
  { name: "Rahul", course: "JaWEsome", hours: 30 },
  { name: "Meera", course: "MERN Full Stack", hours: 55 }
];
console.table(students, ["name", "hours"]);
// Renders a table with only the name and hours columns
Grouping console output with console.group(), groupCollapsed() and groupEnd()
console.group() indents every following console call by one level, until you call console.groupEnd(). console.groupCollapsed() does the same, but the group starts collapsed and a reader must click it open. See the console.group reference on MDN for details. Use grouping to keep a busy console scannable when one function logs several related lines.
console.group("Validating form");
console.log("Checking email:", email);
console.log("Checking password length:", password.length);
console.groupEnd();
Counting calls with console.count() and console.countReset()
console.count(label) logs how many times it has run with that label. It uses the label "default" when you give none. A separate console.countReset(label) resets one counter back to zero, per the console.count reference on MDN. This replaces a hand-rolled counter variable when you just want to know how often a function or branch runs.
function renderCard() {
  console.count("renderCard called");
}
renderCard(); // renderCard called: 1
renderCard(); // renderCard called: 2
console.countReset("renderCard called");
Timing code with console.time() and console.timeEnd()
console.time(label) starts a named timer. console.timeEnd(label) stops it and prints the elapsed time in milliseconds. A page may run up to 10,000 timers at once, each with its own label. See the console.time reference on MDN for the full detail. Treat that figure as a scale ceiling, not a target. Most debugging sessions use one or two timers around the code path you suspect is slow.
console.time("sortStudents");
students.sort((a, b) => a.hours - b.hours);
console.timeEnd("sortStudents");
// sortStudents: 0.42ms
Tracing calls with console.trace()
console.trace() prints a stack trace from the point where you call it. It shows the chain of function calls that led there. Some browsers also include async call chains, per the console.trace reference on MDN. Add it inside a shared function when you need to know which caller triggered a run. This beats guessing from the code alone.
function saveDraft() {
  console.trace("saveDraft called from:");
}
function onInputChange() {
  saveDraft();
}
onInputChange();
// Prints the call stack: saveDraft -> onInputChange -> (caller)
Asserting conditions with console.assert()
console.assert(assertion, message) writes an error message only when assertion is false. It prints nothing at all when the assertion is true, as the console.assert reference on MDN shows. It does not print a stack trace the way console.trace() does. Use it as a quiet check you leave in code. It stays silent while an assumption holds, and speaks up the moment it does not.
console.assert(total >= 0, "Total should never be negative", total);
// Nothing prints while total is 0 or more
// Prints "Assertion failed: Total should never be negative -5" once it goes negative
Inspecting objects with console.dir()
console.dir(object) prints an interactive, hierarchical list of the properties that belong directly to the object. That differs from the pretty, inspector-style rendering that console.log() gives the same object. See the console.dir reference on MDN for details. This matters most on DOM elements. console.log(element) shows the element as it renders on the page. console.dir(element) shows it as a plain object instead, with properties you can expand one by one.
const button = document.querySelector("button");
console.log(button); // Shows the rendered element, like the Elements panel
console.dir(button); // Shows a plain property list: onclick, style, children...
Comparison: which method to reach for
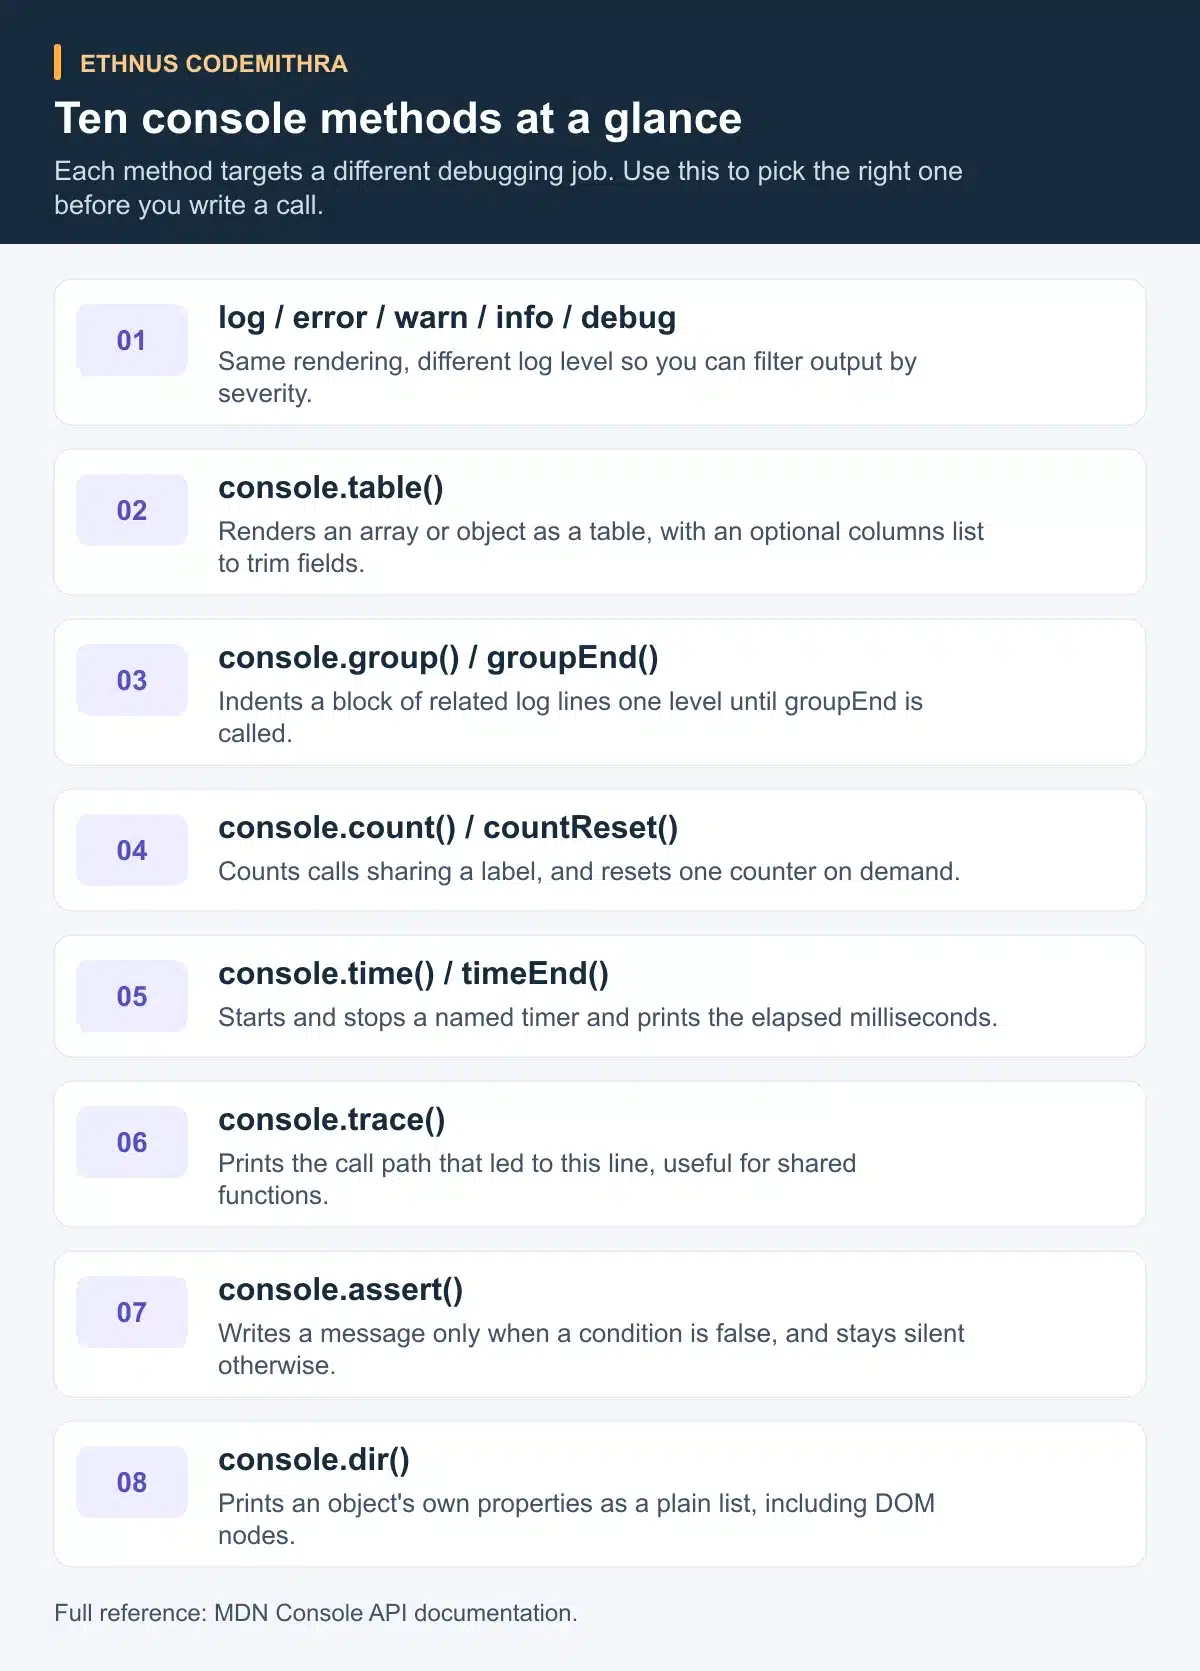
| Method | Purpose | One-line example |
|---|---|---|
| console.log/error/warn/info/debug | Print output at a chosen level for filtering | console.warn("Slow query", ms) |
| console.table() | Show array or object data as a table | console.table(students) |
| console.group() / groupEnd() | Indent related lines together | console.group("Init") |
| console.count() / countReset() | Count calls per label | console.count("render") |
| console.time() / timeEnd() | Measure elapsed time | console.time("sort") |
| console.trace() | Print the call path to this line | console.trace("called from:") |
| console.assert() | Log only when a condition fails | console.assert(total >= 0) |
| console.dir() | List properties that belong to an object | console.dir(document.body) |
Try it: pick the right method for a bug you have now
Take a function from a project you have. Before you write a single log line, decide which method fits your question.
To know how often the function runs, use console.count(). To know who calls it, use console.trace(). To know how long it takes, wrap it in console.time() and console.timeEnd(). If it processes a list, log that list with console.table() instead of console.log(). Doing this once on a real function teaches the methods faster than reading about them.
Cleaning up before production
Debug-only console calls left in a shipped bundle slow the page down slightly. They can also leak internal details to anyone with DevTools open. Build the habit of deciding, as you write a console call, whether it belongs only in development. A genuine console.error() on a failed request can still stay for production diagnostics. Modern build tools can strip console calls from a production build through minifier settings. Check the current minification options in your build tool rather than let debug logging ship by accident.
Where this fits in an Ethnus program
Console debugging sits on top of JavaScript, DOM and BOM fundamentals. The JaWEsome program at Codemithra teaches these topics. Its published syllabus lists "BOM (Browser Object Model)", "DOM (Document Object Model)" and "Advanced working with functions". The MERN Full Stack program carries the same JavaScript, BOM and DOM topics further.
Its React and Node.js modules each include a dedicated debugging topic: "Debugging React Apps" and "Debugging Node JS Application". These console methods apply directly there, on a real front end and back end. Both programs deliver live sessions with step-by-step walkthroughs and instant doubt clearing. You can check a method covered here against an explanation from a trainer in class.
Frequently asked questions
Is console.table slower than console.log for large arrays?
The Console API documentation does not publish a performance comparison between methods, so no specific figure is available here. As a general practice, keep debug-only calls out of production builds regardless of which method you use.
Does console.assert stop code execution when the assertion fails?
No. It only writes a message to the console when the assertion is false. The MDN reference confirms this. Unlike a thrown exception, it does not throw an error or stop the script.
Can I nest console.group calls?
Yes. Calling console.group() again before the matching console.groupEnd() adds another indent level. This is useful for grouping the internal steps of a function inside a larger operation.
Do these methods work the same in every browser?
The core methods here belong to the standard Console interface. Major browsers document them, though exact formatting in the DevTools panel can vary slightly between them.
Practise these methods inside a real project rather than a script you throw away. The JaWEsome program at Codemithra covers the JavaScript, DOM and BOM foundations these methods sit on. The MERN Full Stack program puts them to work in its React and Node.js debugging topics.